Building Your First Flow
Walk through a realistic flow end to end: take a customer export, keep only active accounts, drop internal-only fields, derive a
signup_yearcolumn, and write the cleaned file out as CSV. About ten minutes.
The Quick Start builds a three-node flow as a mechanics check. This guide assumes you’ve done that and shows what a real flow tends to look like — five nodes, a couple of decisions per node, and a final output you can hand to someone.
The example: you have a customer CSV exported from another system. It contains every account ever created, including internal test rows; it has columns nobody downstream cares about; and the signup_date field is a full ISO timestamp when all you actually need is the year. By the end of this guide the flow produces a cleaned file ready for a colleague to use.
The input
Section titled “The input”Download the sample CSV to follow along — five rows, nine columns, mirrors the table below.
The starting CSV looks like this:
| customer_id | full_name | phone | signup_date | tier | balance | internal_notes | status | |
|---|---|---|---|---|---|---|---|---|
| 1042 | Alice Anderson | [email protected] | 555-0142 | 2023-03-12T09:14:00Z | pro | 320.50 | active | |
| 1043 | Bob Brown | [email protected] | 555-0177 | 2024-04-01T11:02:00Z | standard | 45.00 | active | |
| 1044 | qa-test-001 | [email protected] | 000-0000 | 2024-06-18T08:00:00Z | standard | 0.00 | seed data — exclude | active |
| 1045 | Carol Chen | [email protected] | 555-0218 | 2025-01-22T15:47:00Z | pro | 1240.00 | inactive | |
| 1046 | Dave Davis | [email protected] | 555-0263 | 2025-09-04T10:30:00Z | standard | 88.75 | active |
Five rows; one is an internal test account (internal_notes populated), one is inactive, and the timestamps are noisier than the consumer needs.
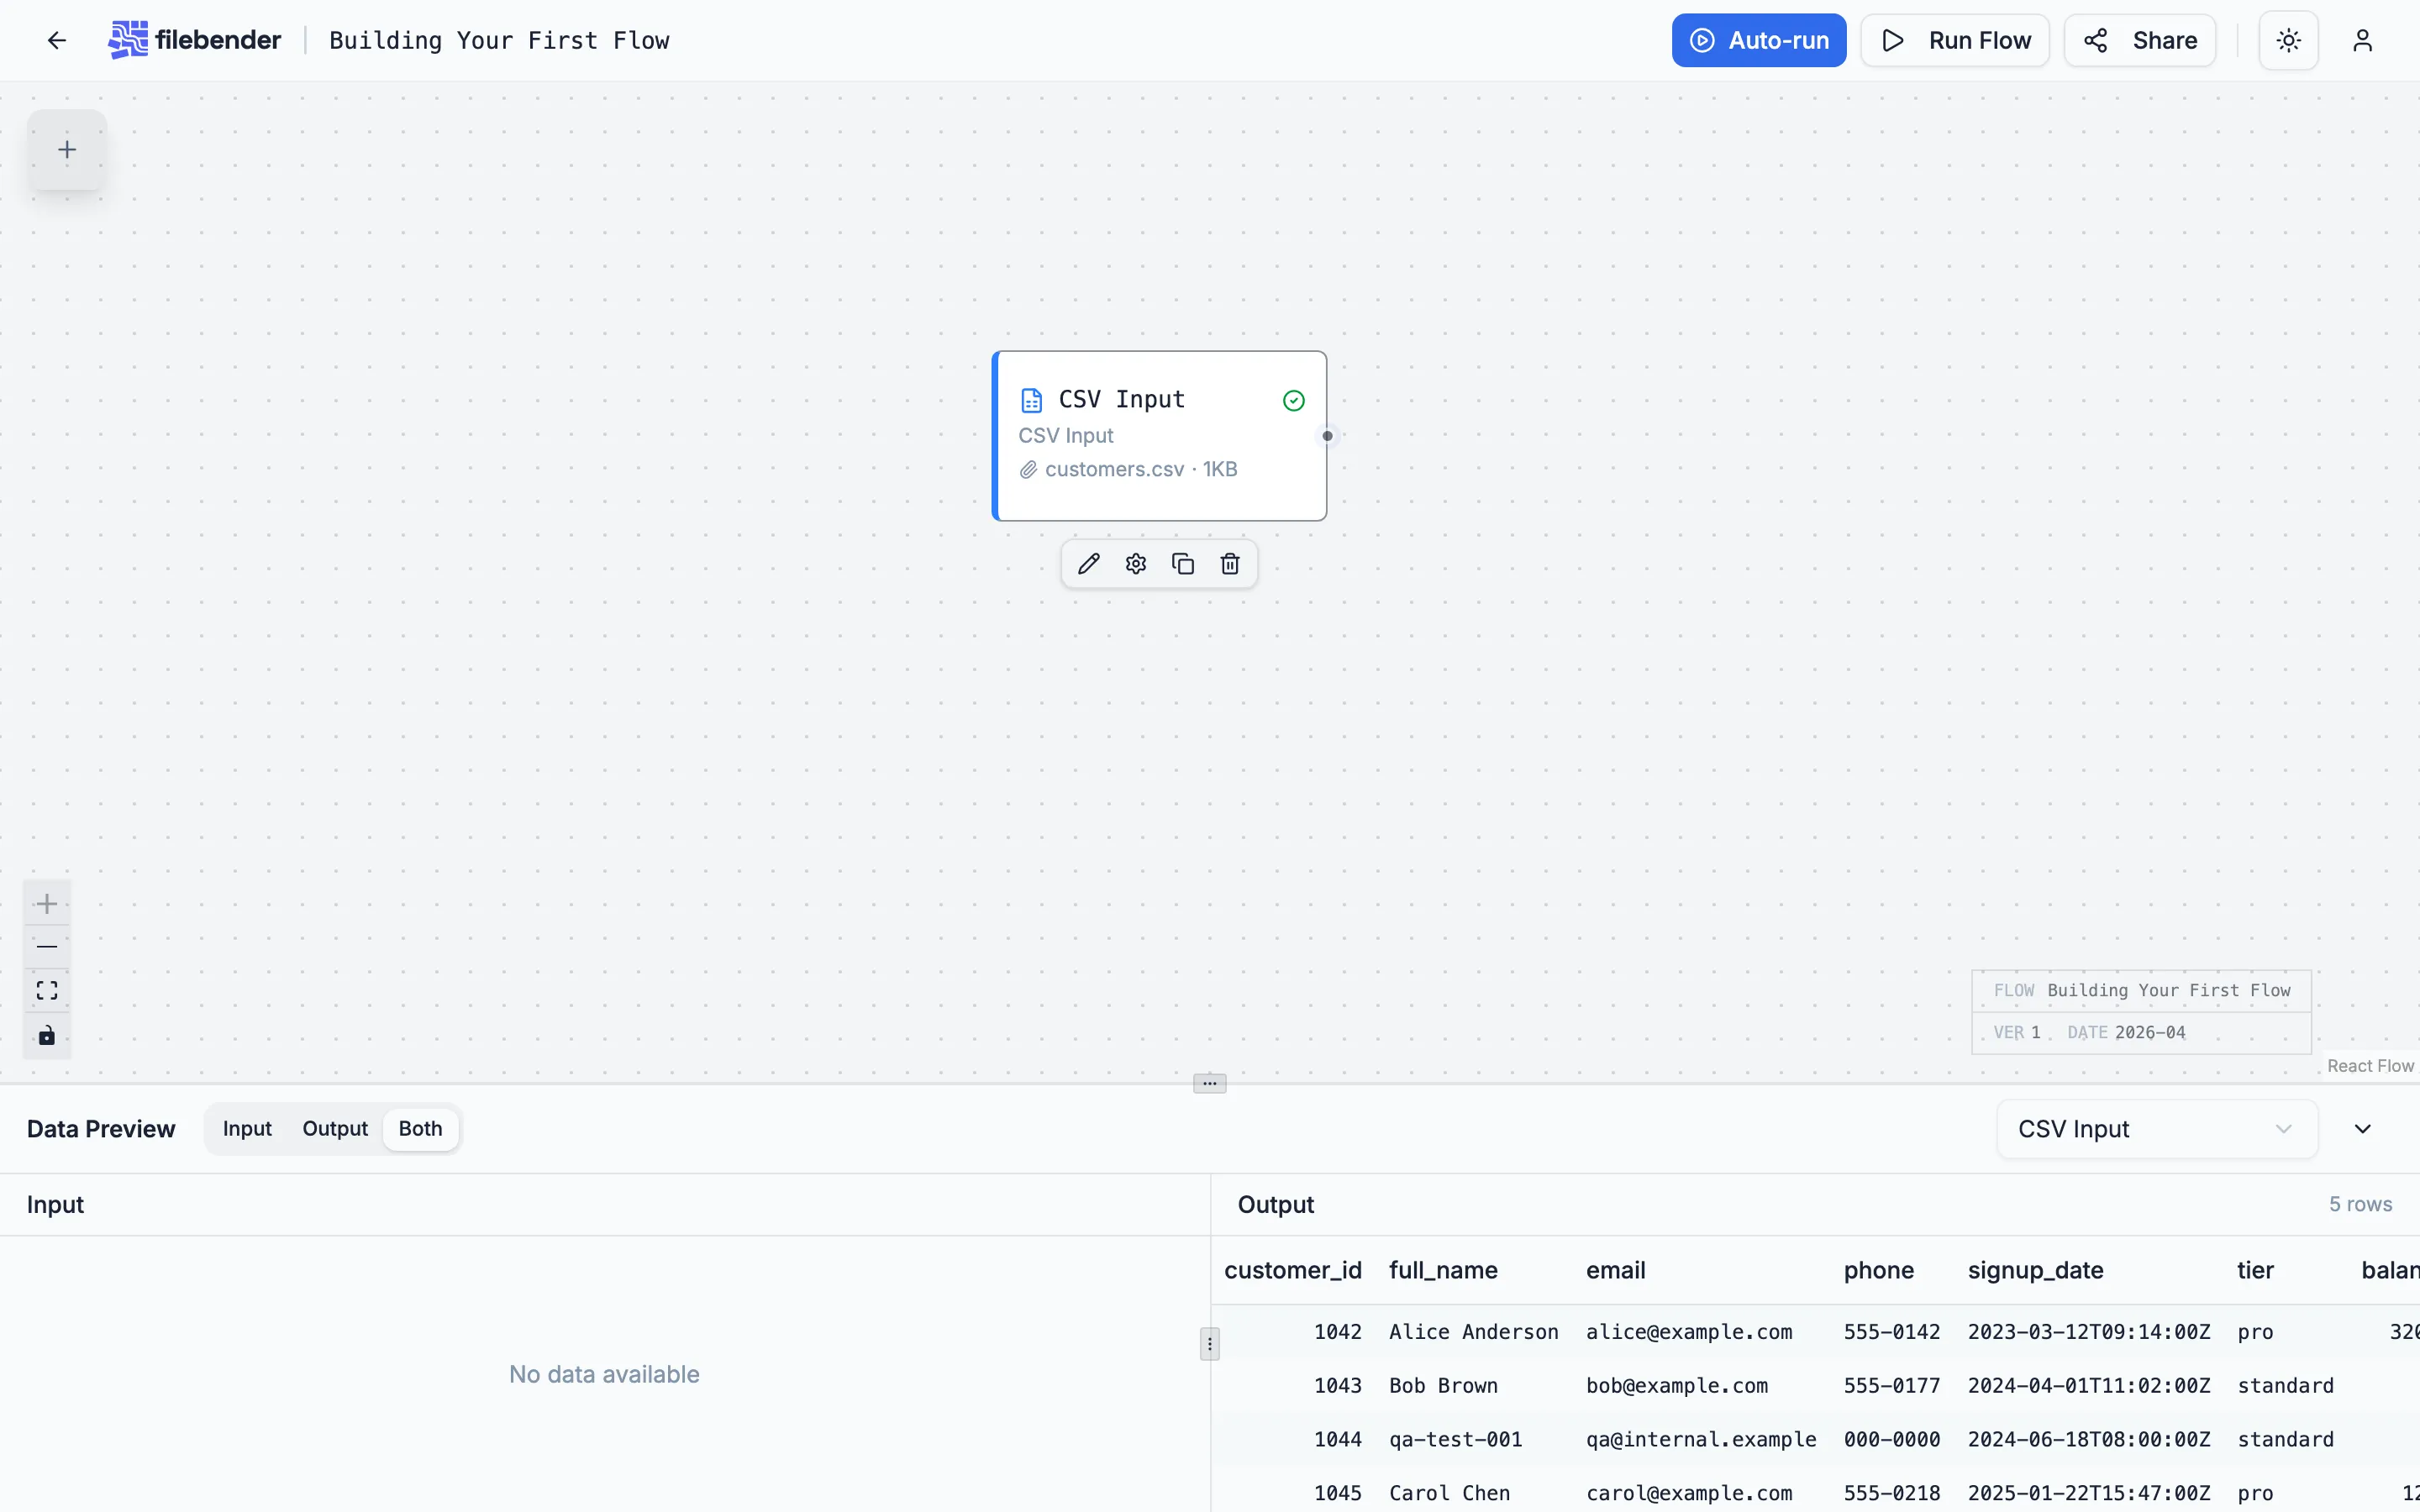
1. CSV Input
Section titled “1. CSV Input”Create a new flow from the dashboard. Drag a CSV Input node onto the canvas and drop the file on it. The schema and a preview appear underneath the node.
2. Filter Rows — keep only active, real customers
Section titled “2. Filter Rows — keep only active, real customers”Drag a Filter Rows node onto the canvas and connect the CSV Input’s source handle to its target handle. Double-click the Filter Rows node to open its settings.
Set two conditions in a single group (AND logic):
statusequalsactive— drops Carol’s inactive row.internal_notesis empty — drops the QA seed row.
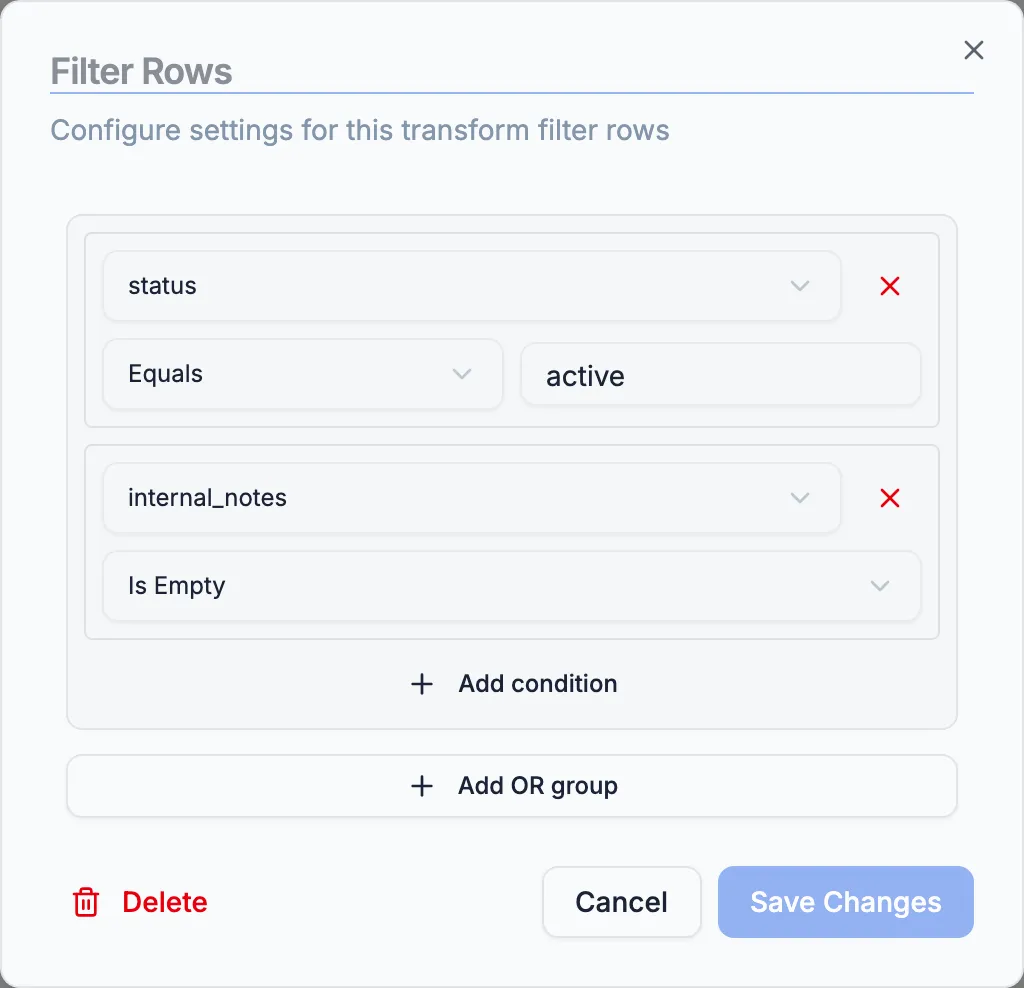
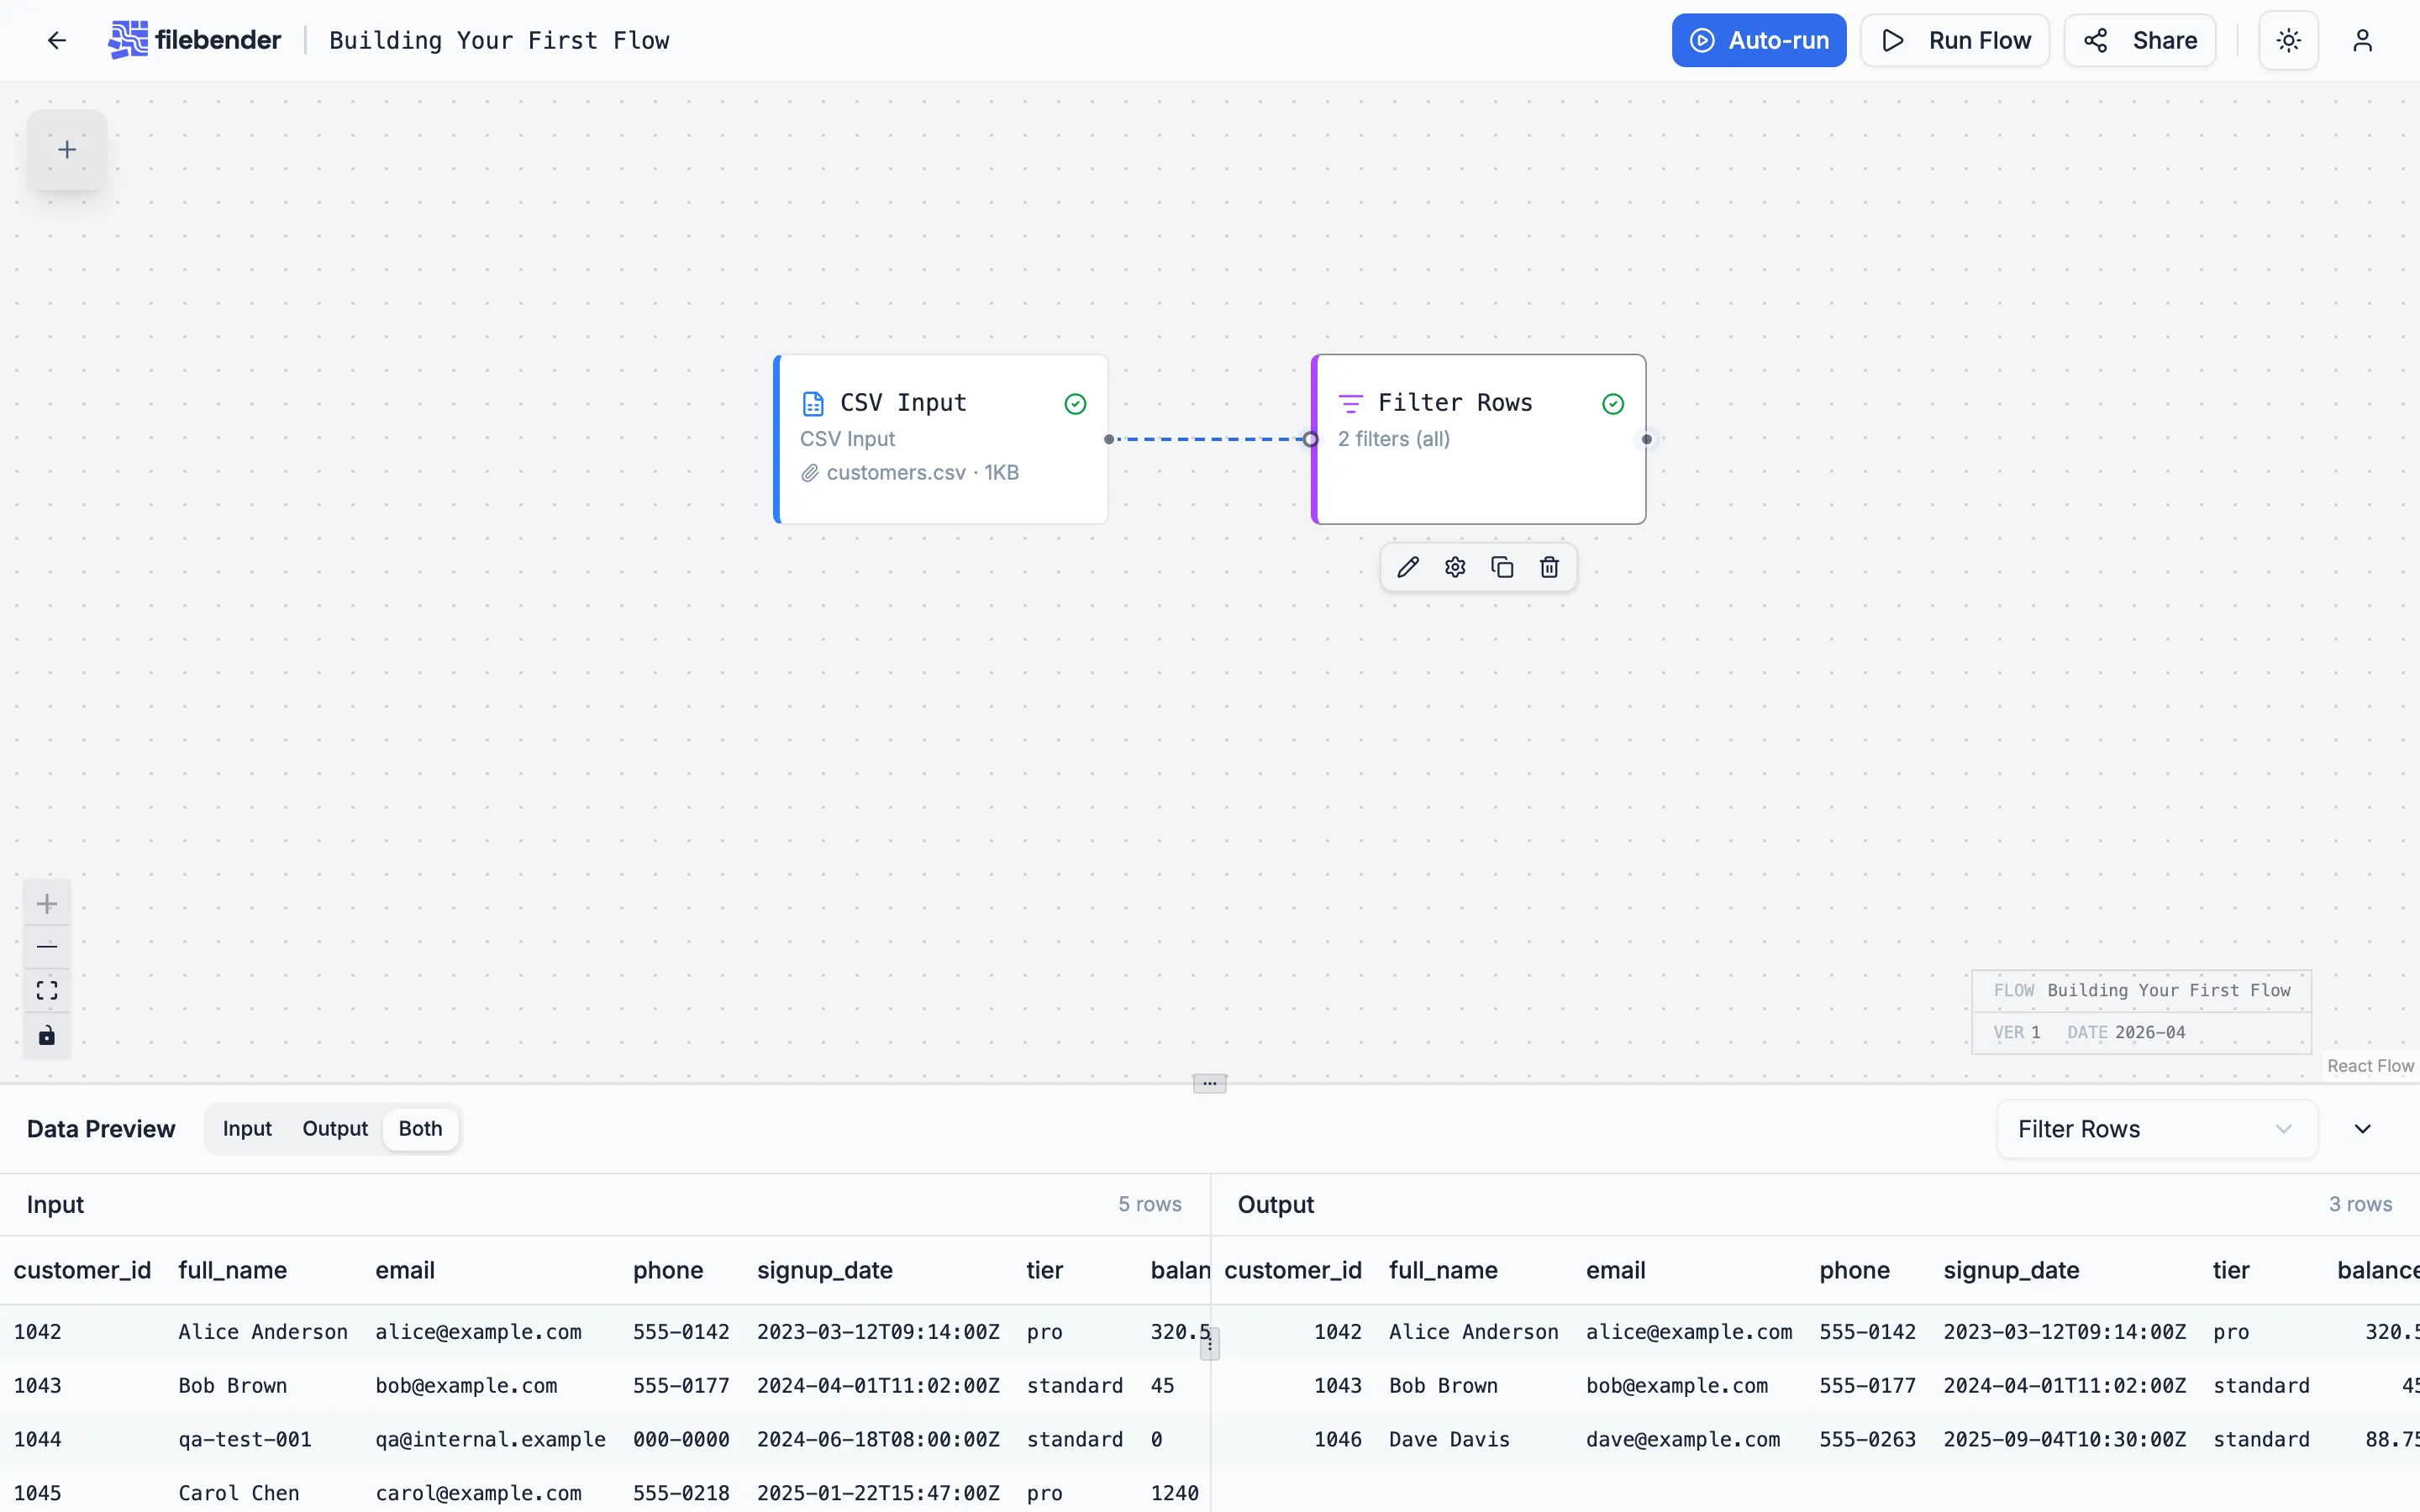
Click Save Changes and run the flow. The preview now shows three rows: Alice, Bob, and Dave.
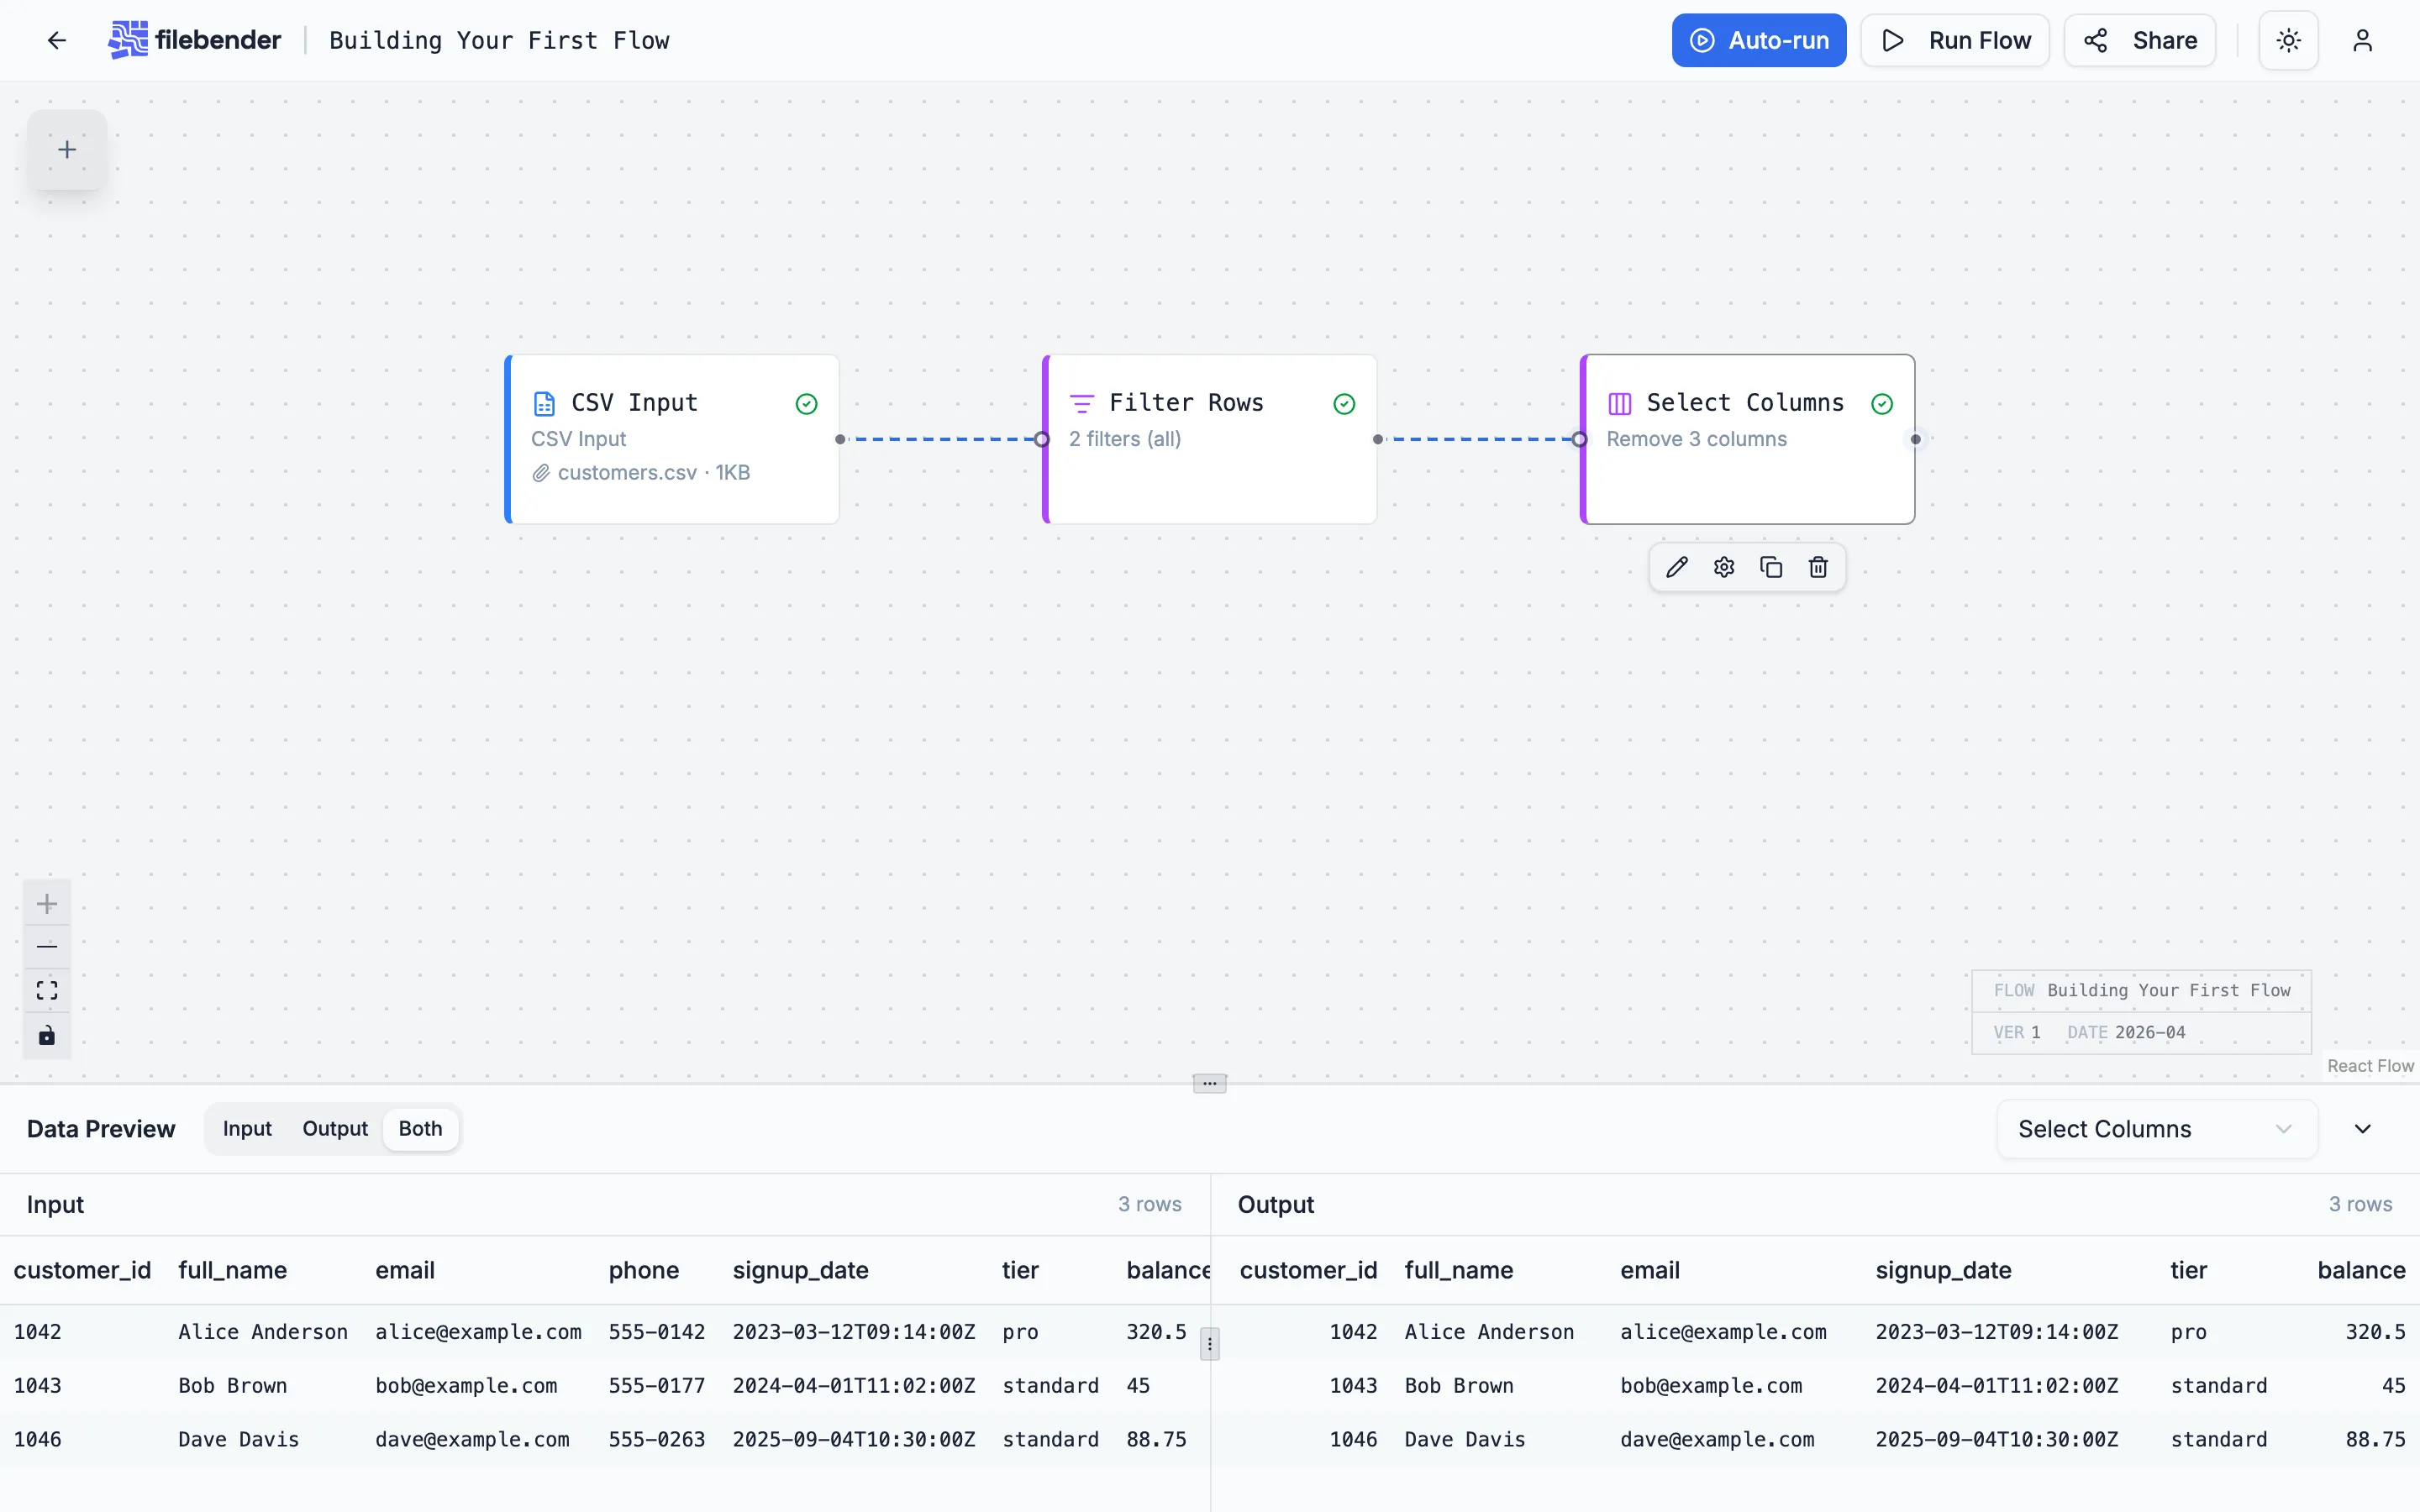
3. Select Columns — drop internal fields
Section titled “3. Select Columns — drop internal fields”The downstream consumer doesn’t need phone, internal_notes, or status. Drag a Select Columns node onto the canvas, connect Filter Rows to it, and double-click to configure. Set the mode to Remove and list the three columns.
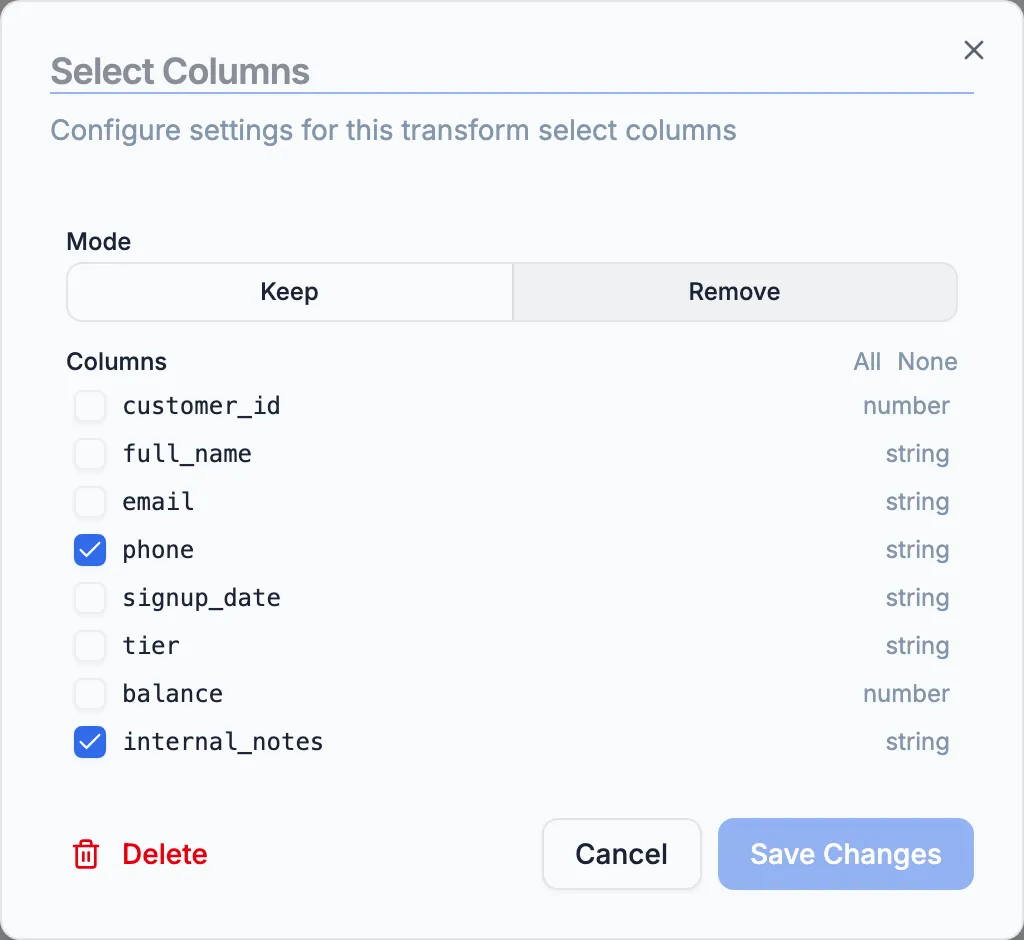
Save and run the flow. The preview confirms the three columns are gone.
You could also use Keep mode and list the columns you want — same result, easier when the keep list is shorter.
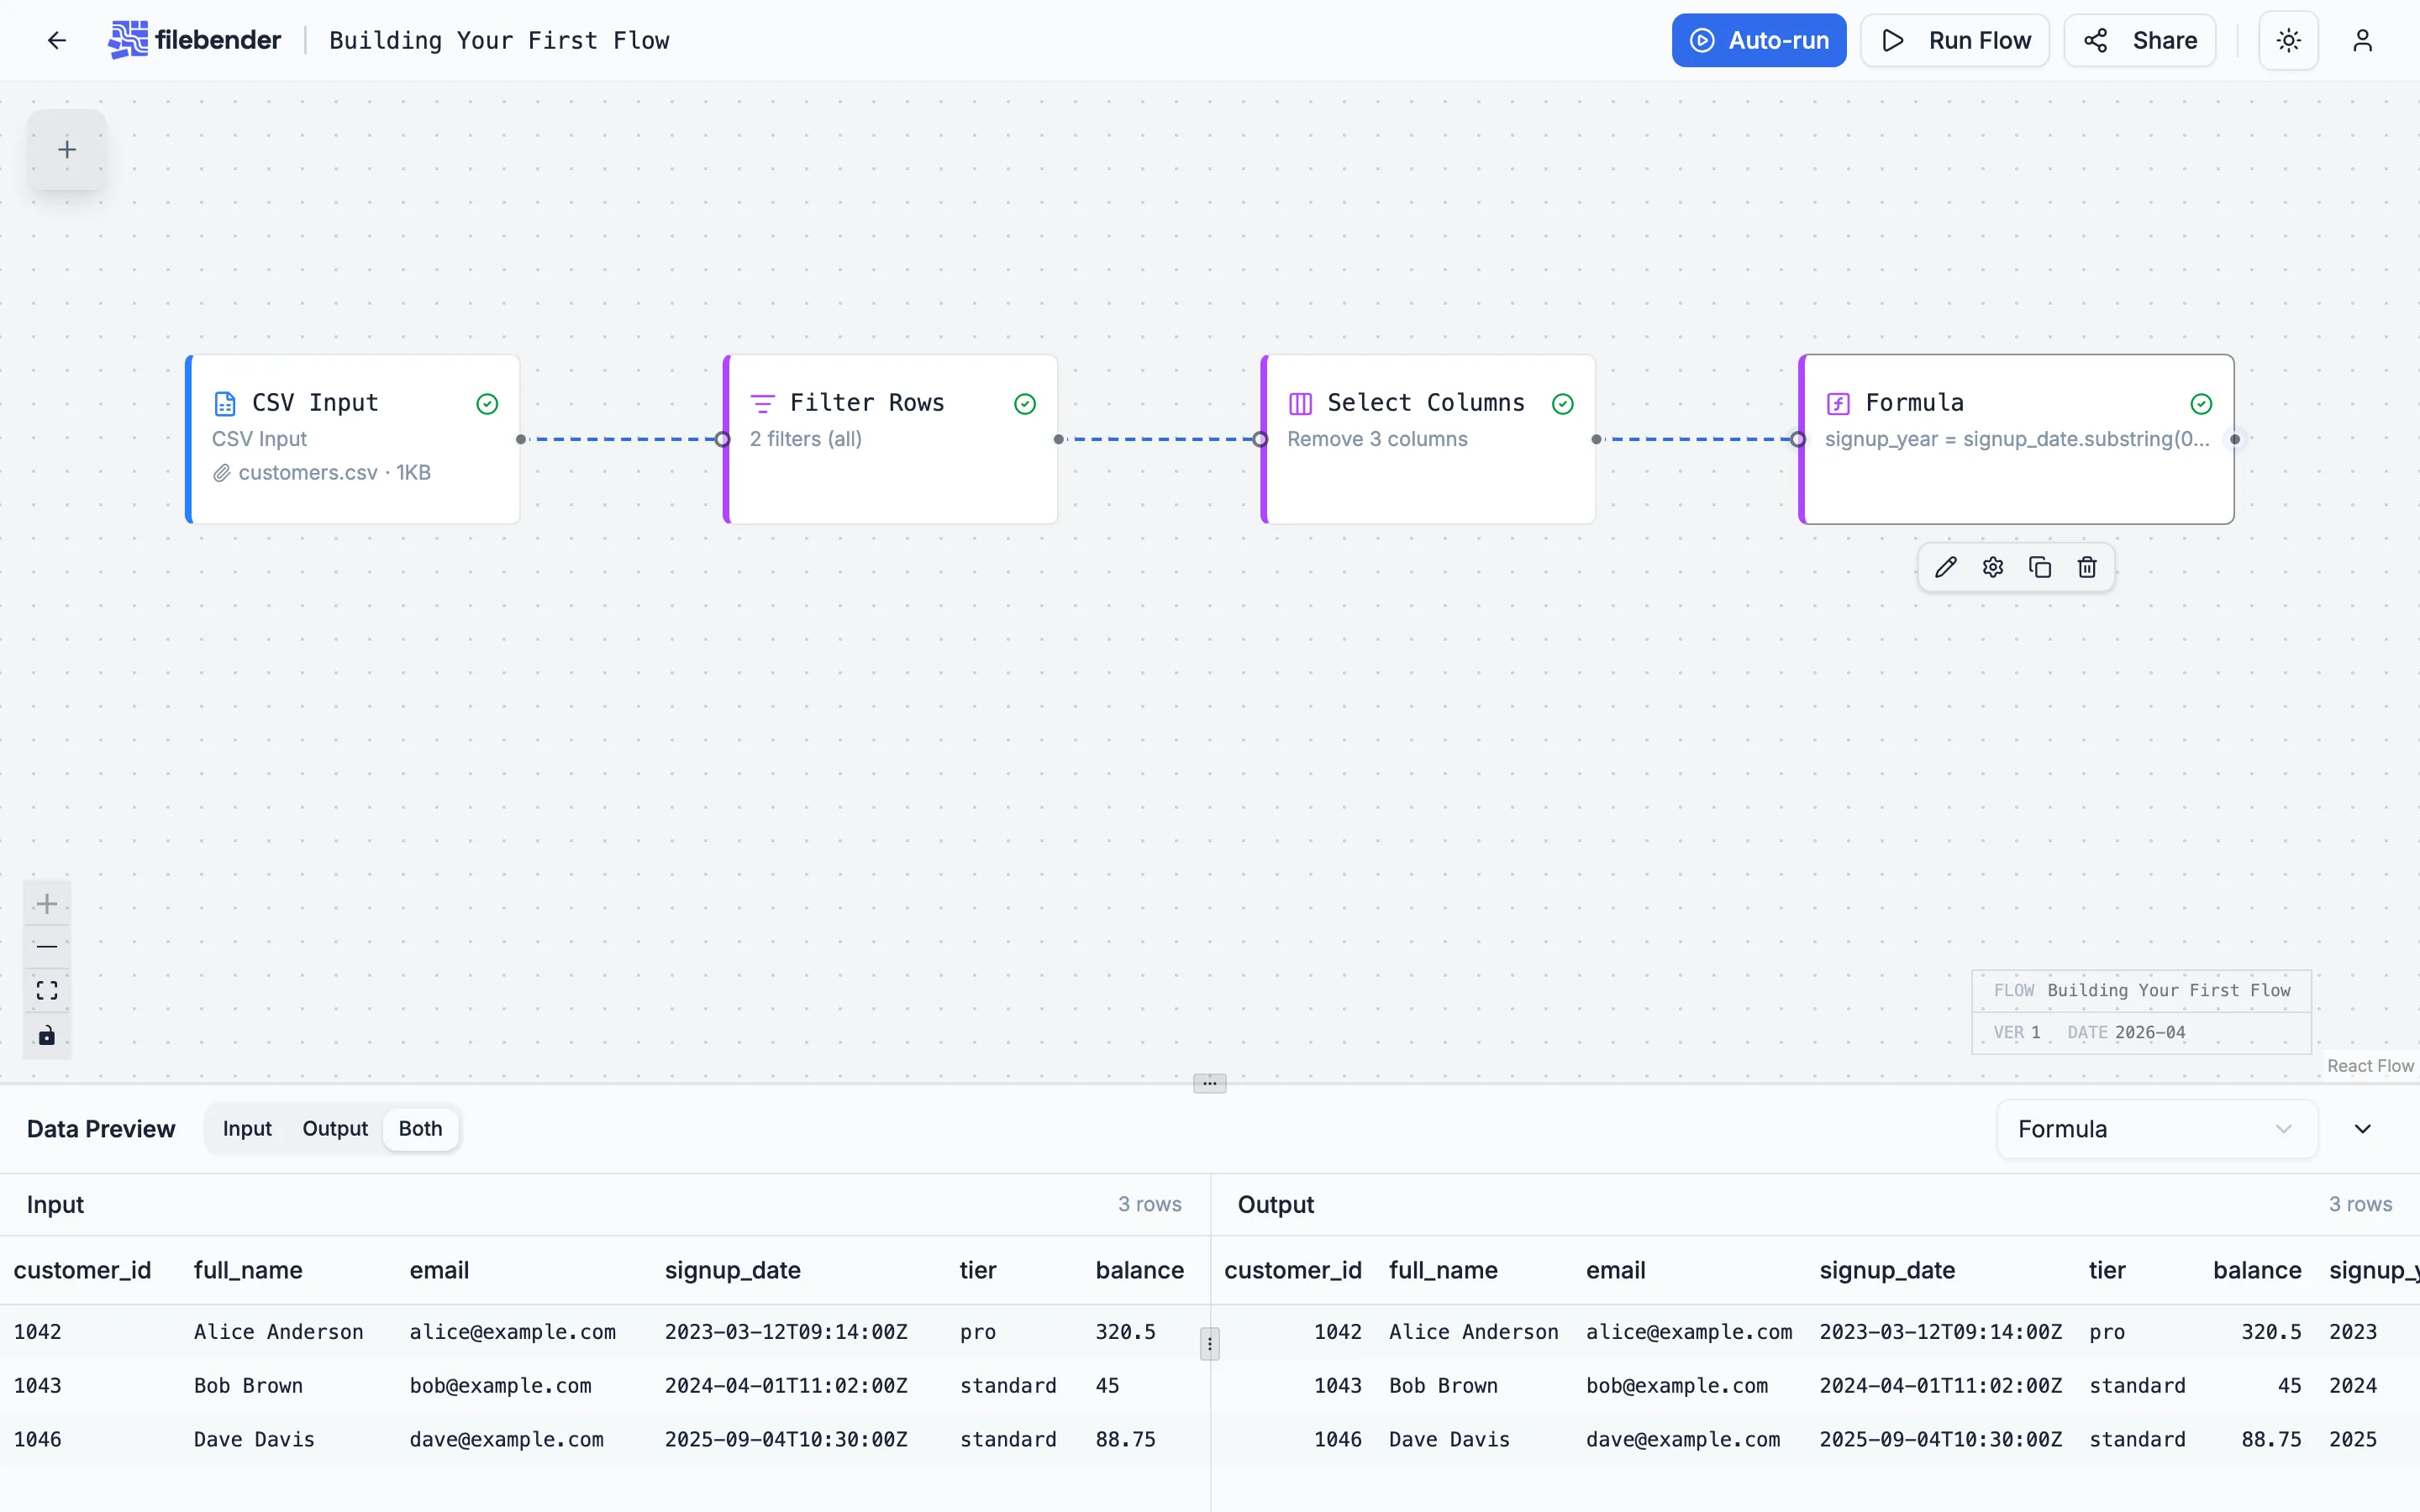
4. Formula — derive signup_year
Section titled “4. Formula — derive signup_year”The consumer wants the year, not the full timestamp. Drag a Formula node (the user-facing name for the Computed Column transform) onto the canvas and connect Select Columns to it. Double-click to configure.
Set the expression to signup_date.substring(0, 4) and the output column name to signup_year. CEL’s substring method takes the first four characters of the ISO timestamp, giving you the year.
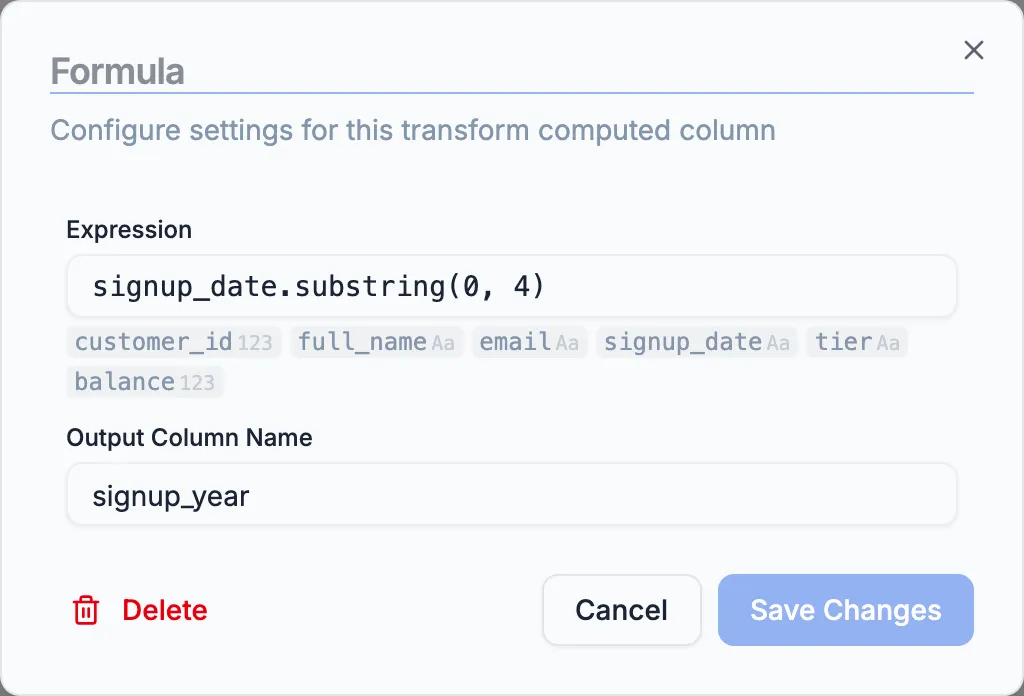
Save and run the flow. The new column appears at the right side of every row.
A note on tier availability: Formula is a Pro-tier transform. On the Free or Starter tier you can substitute Format Dates to reformat signup_date into YYYY style, then Rename Columns to call it signup_year — three nodes instead of one but no Pro features. See the full list at filebender.com/pricing.
5. CSV Output — write the cleaned file
Section titled “5. CSV Output — write the cleaned file”Drag a CSV Output node onto the canvas, connect Formula to it, and click Run in the header. When execution completes, the output node shows a download card.
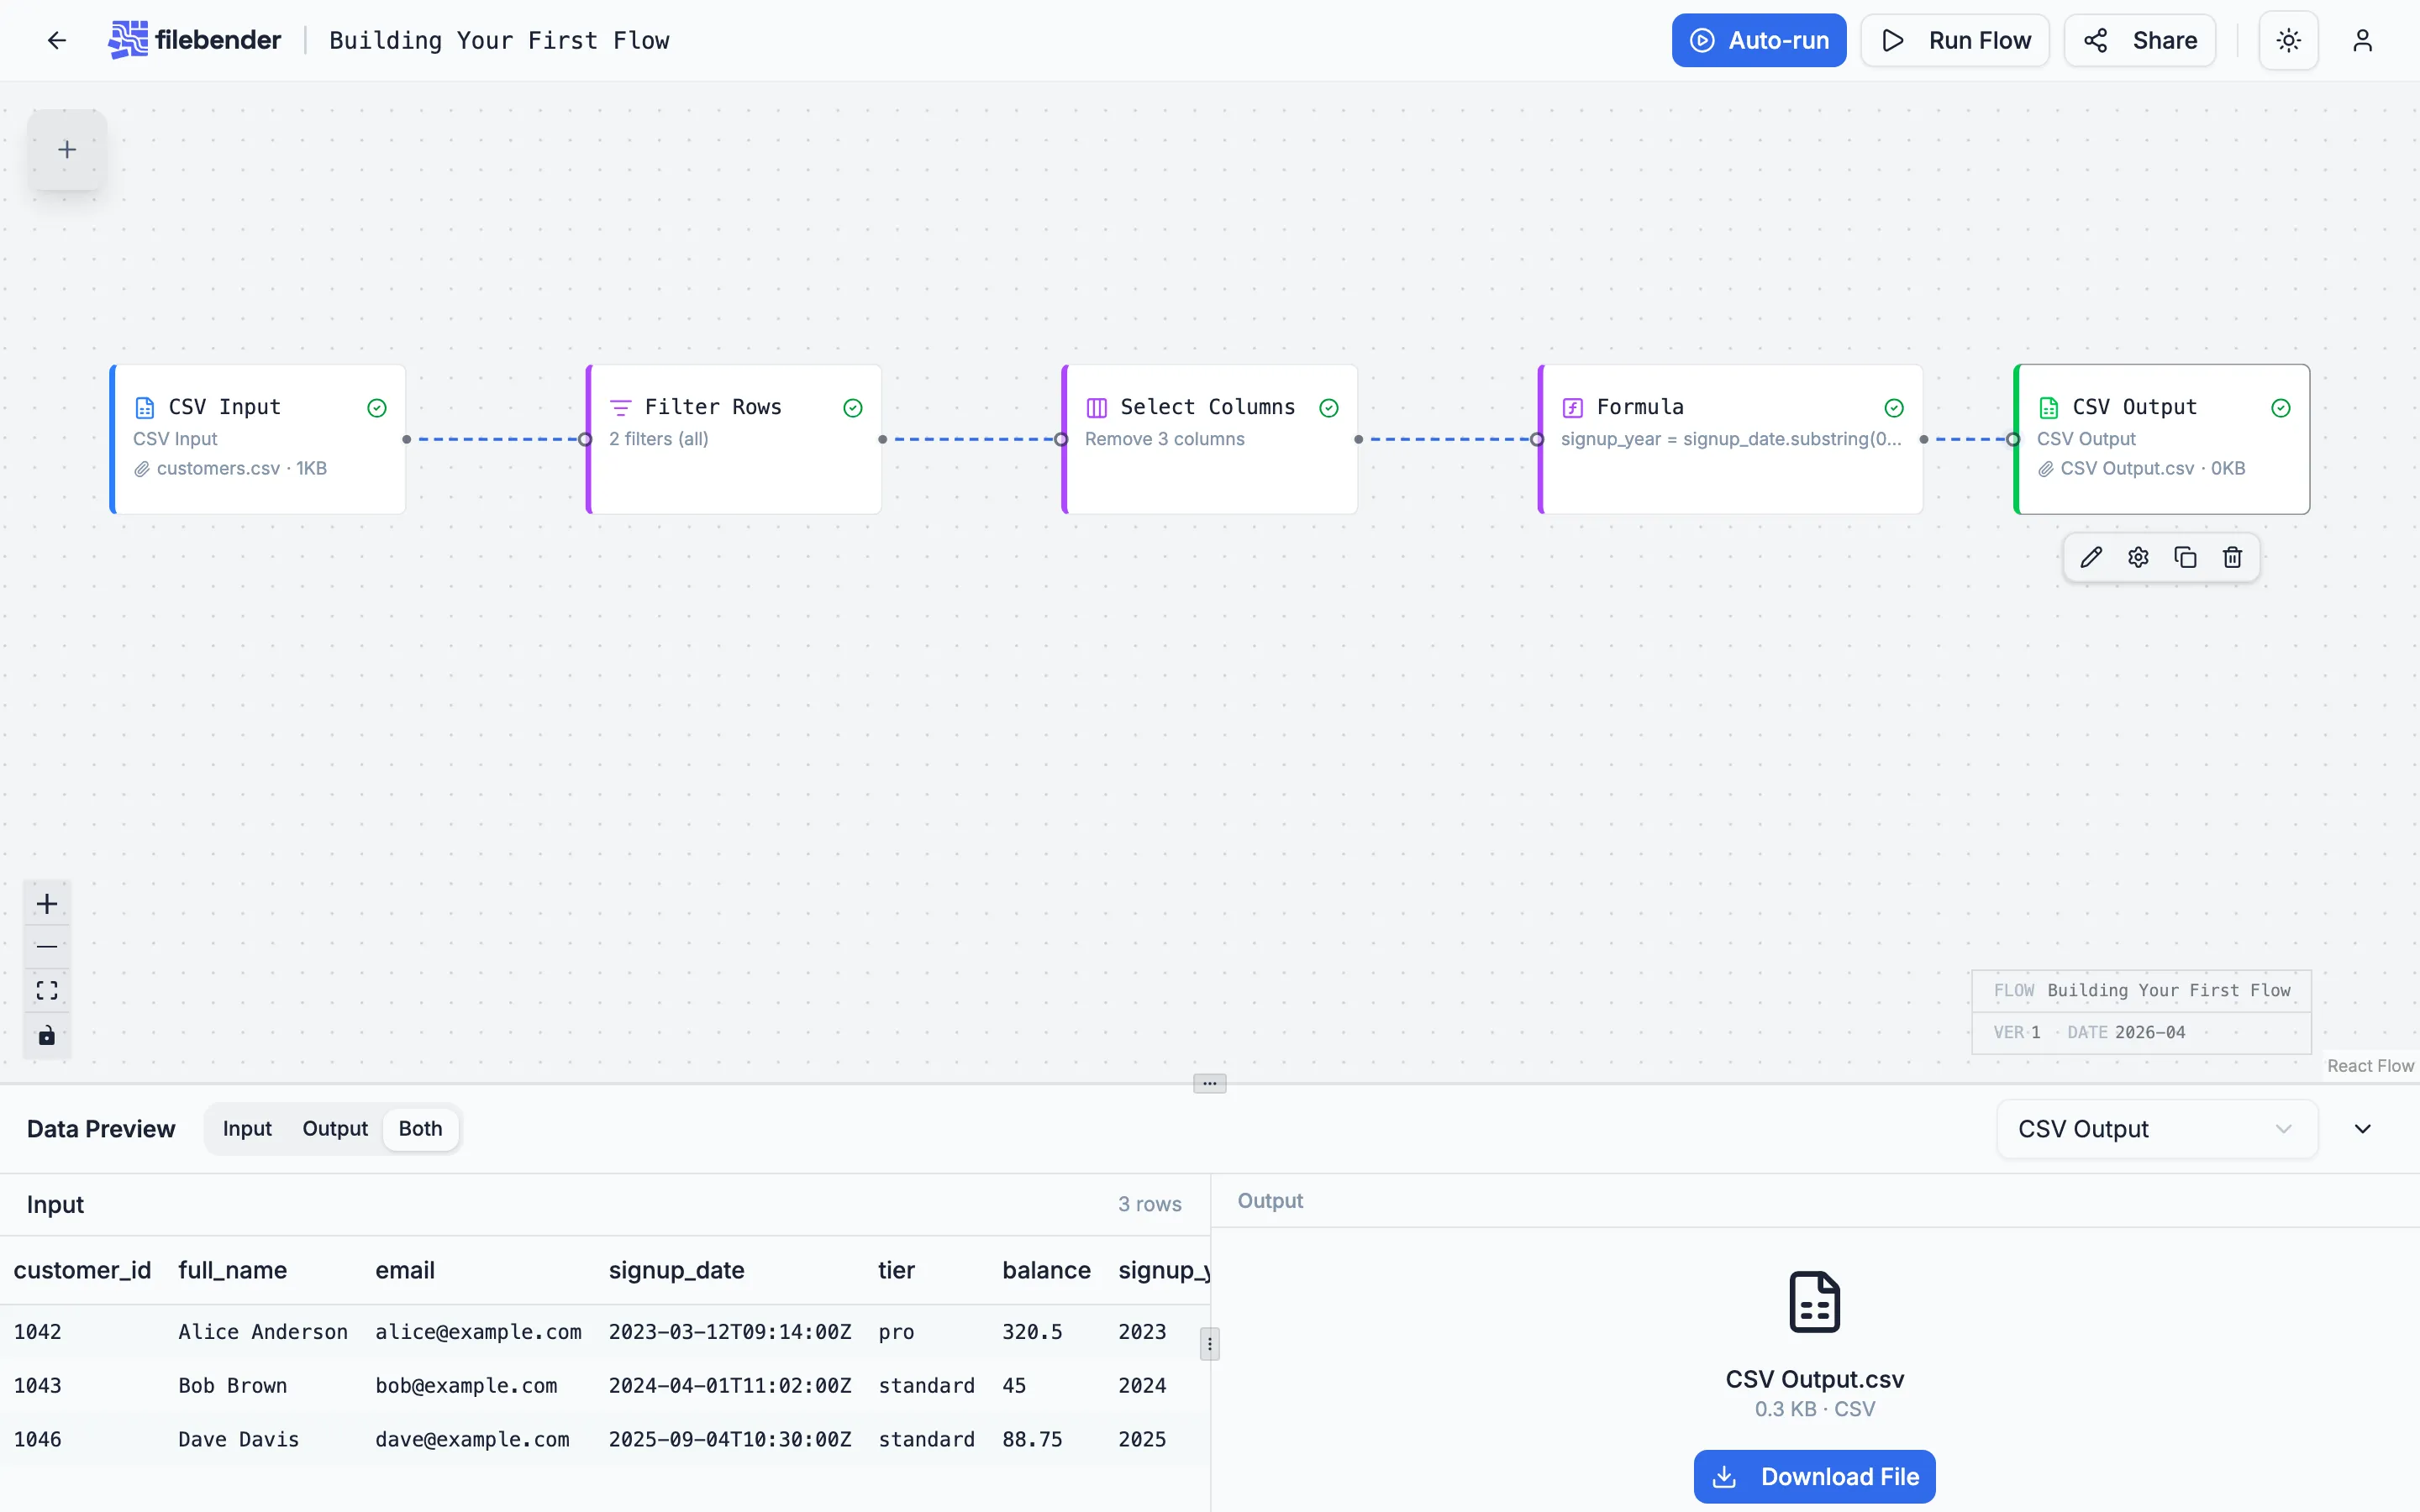
The downloaded file has six columns — customer_id, full_name, email, signup_date, tier, balance, signup_year — and three rows, one per active real customer.
What you built
Section titled “What you built”Five nodes, six columns of real data plus one derived, three rows out of five. The flow runs in milliseconds on a five-row file and scales to whatever the tier row limit allows.
The flow persists in your account. Open it tomorrow, drop a fresh export on the CSV Input node, and run again — the configuration sticks.
Where to next
Section titled “Where to next”- Working with Large Files — how the row limit interacts with each tier, and what to put first in the flow when the file is big.
- Privacy and Data Security — what FileBender does and doesn’t send to a server during a flow run.
- The Transforms reference covers every option for every transform you saw here.